The Representation Gap: Diversity in Global Music Executives
The Representation Gap: Diversity in Global Music Executives
Within the music industry, the representation gap refers to the disconnection between music executives and the artists or audiences they serve. This highlights systemic marginalization, particularly at the executive level (Smith et al., 2021). The music representation gap is seen as a social and widespread imbalance with measurable disparities (Kallio et al., 2021). Additionally, structural barriers to inclusion, such as hiring practices, programming, and executive selection, both reflect and reinforce these gaps. Curators select, organize, and encode musical works, giving them considerable influence over who receives artistic opportunities and recognition, which in turn enables either inclusive or exclusive practices. Data shows that women and minorities have fewer opportunities, face prejudice, and often leave music education, negatively affecting industry diversity (Juhl, 2021).
USC Annenberg Study Statistics: Top Executives & Senior Management Teams
1. Executive Diversity Across 70 Music Companies (Top Roles Only)
| Demographic Group |
Percentage |
Raw Count |
Notes |
| Men |
86.1% |
60 |
Top roles include CEO/Chair/President |
| Women |
13.9% |
10 |
Only 2 were women of color |
| White Executives |
86.1% |
60 |
Across major and independent companies |
| Underrepresented Racial/Ethnic Groups |
13.9% |
10 |
All led independent companies |
| Black Executives |
— |
3 |
Included in underrepresented count |
2. Diversity Profile of Top Executives in Major Music Corporations
| Company Group |
Category |
White Executives (%) |
Female Executives (%) |
Total Executives |
| SME, UMG, WMG, Spotify, iHeart, Cumulus, Audacy, Live Nation, AEG Presents |
Music Groups, Streaming, Radio, Live Music |
100% |
11.1% (1 Female) |
9 Executives |
| Amazon Music, Apple Music, YouTube |
Music + Mixed Revenue Streams |
— |
9.1% (1 Female) |
12 Executives |
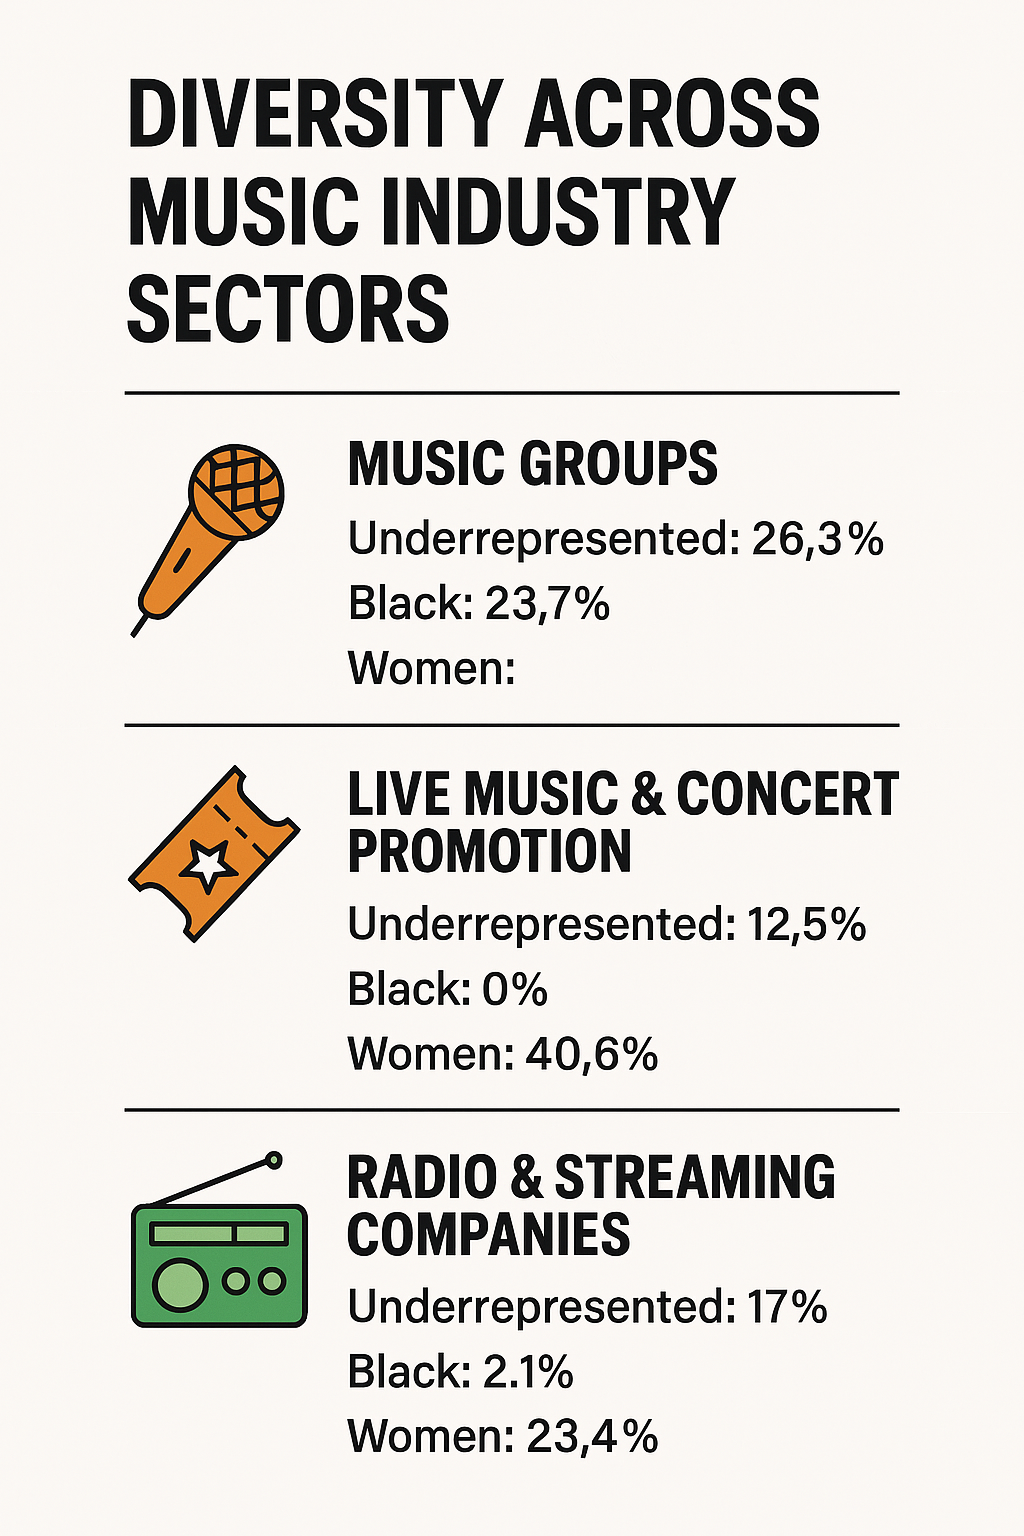
3. Representation on Executive Boards Across Major Music Categories
| Category |
Underrepresented Executives (%) |
Black Executives (%) |
Women in Leadership (%) |
Highlights |
| Music Groups (SME, UMG, WMG) |
26.3% |
23.7% |
— |
Highest racial/ethnic diversity |
| Live Music & Concert Promotion (Live Nation, AEG) |
12.5% |
0% |
40.6% |
Most gender-inclusive |
| Radio & Streaming (Spotify, iHeart, Cumulus, Audacy) |
17.0% |
2.1% |
23.4% |
Middle ground across all metrics |
4. Senior Leadership Diversity Across Music Industry Categories (n=125 Executives, 119 Companies)
| Industry Category |
Underrepresented Execs (%) |
Black Execs (%) |
Women Execs (%) |
Women of Color (%) |
Notable Insights |
| Labels |
21.7% |
16.7% |
— |
— |
Highest Black representation |
| Streaming |
21.4% |
— |
— |
— |
Strong inclusion of underrepresented groups |
| Publishing |
16.7% |
5.6% |
— |
— |
Middle-tier diversity |
| Live Music |
13.3% |
6.7% |
— |
— |
Moderate diversity |
| Radio |
6.7% |
6.7% |
— |
— |
Low representation |
| Music Groups |
0% |
0% |
— |
— |
No diversity reported |
| Overall |
17.6% |
10.4% |
12.8% |
3.2% |
Sample size: 125 execs |
5. Representation of Senior Executives Across Music Industry Categories
| Industry Category |
Underrepresented Executives (%) |
Black Executives (%) |
Women in Top Roles (%) |
| Labels |
21.7% |
16.7% |
— |
| Streaming |
21.4% |
— |
— |
| Publishing |
16.7% |
5.6% |
— |
| Live Music |
13.3% |
6.7% |
— |
| Radio |
6.7% |
6.7% |
— |
| Music Groups |
0% |
0% |
— |
6. Representation of Women and Women of Color in Top Executive Roles
| Industry Category |
Women in Top Roles (%) |
Women of Color (%) |
Contextual Insight |
| Publishing |
22.2% |
5.6% |
Only one woman of color held a top role |
| Radio |
20.0% |
— |
High overall gender representation, no racial detail |
| Labels |
— |
5.0% |
One of two categories with women of color leadership |
Executive Ranks: CEOS, EVPs/SVPs/GMs, VP/Heads
1. Executive Representation by Role and Identity Group (Across 4,060 Executives, 119 Companies)
| Executive Level |
Women (%) |
White Women (%) |
Underrepresented Women (%) |
Black Women (%) |
| VPs / Heads |
41.3% |
— |
9.2% |
3.0% |
| EVPs / SVPs / GMs |
31.6% |
— |
8.2% |
3.3% |
| CEOs / Chairs / Presidents |
20.5% |
— |
5.6% |
2.4% |
2. Summary of Underrepresented and Black Executive Representation (All Ranks)
| Group |
% of Total Execs |
Male Count |
Female Count |
Insight |
| Underrepresented Executives |
19.8% |
459 |
341 |
Inertia across hierarchy |
| Black Executives |
7.5% |
184 |
122 |
Only 1 Black woman per 17.7 white men |
| White Women |
26.9% |
— |
— |
Linear decline by seniority |
| Women of Color |
8.4% |
— |
— |
Minimal representation across ranks |
Executive Ranks by Category
1. Executive Representation Across Music Industry Categories
| Industry Category |
Underrepresented Executives (%) |
Black Executives (%) |
Women Executives (%) |
Underrepresented Women Executives (%) |
| Streaming |
~25% |
7.4% |
— |
12.5% |
| Music Groups |
~25% |
7.2% |
— |
11.4% |
| Labels/Label Groups |
~25% |
14.4% |
— |
10.3% |
| Publishing |
— |
6.1% |
31.9% |
7.1% |
| Radio |
12.3% |
4% |
33.2% |
4.4% |
| Live Music & Concert Promotion |
— |
3.3% |
39.1% |
9.0% |
2. Representation of Black Women Executives by Industry Category
| Industry Category |
Black Women Executives (%) |
Placement Insight |
| Labels |
5.3% |
Highest representation |
| Streaming |
3.8% |
Middle range |
| Music Groups |
3.6% |
Middle range |
| Publishing |
1.9% |
Middle–low representation |
| Live Music |
1.7% |
Low representation |
| Radio |
1.4% |
Lowest representation |
Artists and A&R Executives
Artist and Executive Demographics in Major Label Affiliations
| Category |
Subgroup |
Percentage (%) |
| Artists (n=1,750) |
Underrepresented Groups (Total) |
48.3% |
| Underrepresented Men |
33.8% |
| Underrepresented Women |
14.6% |
| Black Artists (Total) |
31.2% |
| Black Men |
22.7% |
| Black Women |
8.5% |
| Gender Identity (Artists) |
Men |
67.8% |
| Women |
31.8% |
| Gender Non-Binary |
1% |
| N/A |
— |
| Race/Ethnicity × Gender |
White Men |
34.2% |
| Underrepresented Men |
33.8% |
| White Women |
17.4% |
| Underrepresented Women |
14.6% |
| A&R Executives |
Underrepresented (Total) |
34.2% |
| Black (Total) |
21.2% |
| Women (Total) |
26.7% |
| Underrepresented Women |
9.5% |
| Black Women |
4.8% |
Established Artists and their Managers, Agents & Publicists
Billboard Hot 100 Artists (2012–2020) and Representation Demographics
| Role |
Identity Group |
Percentage (%) |
Hot 100 Artists
(n=242) |
Underrepresented Men |
43.4% |
| White Men |
26.0% |
| White Women |
18.6% |
| Underrepresented Women |
11.6% |
| Managers |
White (Total) |
61.1% |
| Underrepresented (Total) |
38.9% |
| White Men |
45.8% |
| Underrepresented Men |
27.7% |
| Underrepresented Women |
11.2% (Black Women: 7.5%) |
| Agents |
White (Total) |
79.8% |
| Underrepresented (Total) |
20.2% |
| White Men |
64.6% |
| Underrepresented Men |
15.6% (Black Men: 9.9%) |
| Black Women |
1.2% |
| Publicists |
White Women |
51.9% |
| White Men |
27.4% |
| Underrepresented Men |
8.9% (Black Men: 4.4%) |
| Underrepresented Women |
11.9% (Black Women: 7.4%) |
Relationship between Identity of Artists and their Teams’ Identity
Representation of Team Members by Artist Identity (Manager, Agent, or Publicist)
| Artist Group |
Team Member Type |
Percentage (%) |
| Underrepresented Artists |
≥1 Underrepresented Team Member |
81.2% |
| Only White Team Members |
18.8% |
| ≥2 Underrepresented Team Members |
62.4% |
| White Artists |
No Underrepresented Team Members |
75.2% |
| ≥2 Underrepresented Team Members |
2.7% |
| Black Artists |
≥1 Black Team Member |
79.3% |
| ≥2 Black Team Members |
49.1% |
| Non-Black Artists |
No Black Team Members |
87.5% |
| ≥2 Black Team Members |
2.9% |
| Women Artists |
≥1 Woman Team Member |
84.9% |
| ≥2 Woman Team Members |
69.9% |
| No Woman Team Members |
15.1% |
| Men Artists |
≥1 Woman Team Member |
70.8% |
| ≥2 Woman Team Members |
38.7% |
| No Woman Team Members |
29.2% |
Baltimore Symphony Orchestra Survey
| Survey |
Season |
# of Orchestras |
Women Composer Representation |
Non-White Composer Representation |
Notable Findings |
| Baltimore Symphony Orchestra |
2014/15 |
21 |
14.3% (current composers)
1.8% (all composers) |
Not specified |
Low overall representation of women composers in concert programs. |
| Rob Deemer |
2017/18 |
45 |
~2% |
~2% |
Nearly half the orchestras programmed no music by non-white composers. |
ICD Orchestra Programming Statistics (2019–2020)
| ICD Orchestra Programming Statistics (2019–2020) |
| Total Orchestras Surveyed |
120 |
| Total Performances Analyzed |
4,047 |
| Works by Women Composers (Living & Deceased) |
9.5% |
| Composers from Underrepresented Heritages |
6% |
| Other Categories of Underrepresentation |
11% |
| Performances Featuring All Living Composers |
16% |
| Performances Featuring Deceased Male Composers |
82.5% |
| Beethoven, Mozart, Brahms, Tchaikovsky (Played ≥3 Times) |
89% of orchestras |
| ICD Recommended Programming Distributions |
| Living Composers (General Season) |
25–35% |
| Women Composers (General Season) |
15–25% |
| Underrepresented Heritages (General Season) |
15–25% |
| Living Composers (Contemporary Ensembles) |
60–80% |
| Women Composers (Contemporary Ensembles) |
35–55% |
| Underrepresented Heritages (Contemporary Ensembles) |
35–55% |
Orchestral Diversity Survey – 2020/2021
| Orchestral Diversity Survey – 2020/2021 |
|---|
| Scandinavia |
| Iceland Symphony Orchestra: Works by both men & women | 51.35% |
| Royal Stockholm Philharmonic Orchestra (Sweden) | 46.97% |
| Iceland – All women composers programmed | 18.38% |
| Iceland – Black & Asian men composers | 2.21% |
| Iceland – Black & Asian women composers | 0.74% |
| Sweden – All women composers programmed | 24.20% |
| Sweden – Black & Asian composers (men & women) | 0.92% |
| International Averages |
| Works by Black & Asian men | 2.43% |
| Works by Black & Asian women | 1.11% |
| UK & US Highlights |
| Chineke! Orchestra – Works by both men & women | 72.73% |
| Chineke! – Compositions by women | 25% |
| Chineke! – By Black & Asian women | 22.92% |
| Chineke! – Of male compositions, Black & Asian men | 35.42% |
| Chicago Sinfonietta – Performances with both genders | 100% |
| Chicago Sinfonietta – Black & Asian women composers | 38.46% |
| Chicago Sinfonietta – Male composers (Black & Asian) | 61.54% (23.08% Black & Asian) |
| Performance Counts |
| Chicago Sinfonietta – Total Performances | 3 |
| Chicago Symphony Orchestra – Total Performances | 140 |
| Chineke! Orchestra – Total Performances | 11 |
| London Symphony Orchestra – (reference only) | — |
Women in Film Scoring: Representation Snapshot
| Women in Film Scoring: Representation Snapshot |
| Scores by Women in Top 100-Grossing Hollywood Films (2019) |
5.2% |
| Academy Awards for Best Original Score (Total: 92 Awards) |
3 Women Winners |
Gender Diversity in Music Festivals – female:pressure FACTS Survey
| Gender Diversity in Music Festivals – female:pressure FACTS Survey |
|---|
| Global Festival Gender Makeup (2017–2019, ~400 Editions) |
| Female Acts | 20.5% |
| Non-Binary Acts | 0.6% |
| Male Acts | 70.3% |
| Gender-Mixed Acts | 6.6% |
| Unidentified Acts | 2.0% |
| Expanded Timeline (2012–2019) |
| Female Acts | 17.3% |
| Male Acts | 74% |
| Gender-Mixed Acts | 6.9% |
| Unidentified Acts | 1.5% |
| Regional Gender Distribution (2020 Survey) |
| Asia – Least Even Distribution | — |
| The Pacific – Most Even Distribution | — |
| Europe – Female Acts | 21.3% |
| Europe – Male Acts | 68.8% |
| North America – Female Acts | 17.9% |
| North America – Male Acts | 74.4% |
Festival Diversity vs. Line-Up Size & Curatorial Team Composition
| Festival Diversity vs. Line-Up Size & Curatorial Team Composition |
| Line-Up Size Impact on Gender Diversity |
| Line-Up Size Range |
Trend Observed |
Diversity Impact |
| Below 20 Acts |
Smaller Festivals |
Higher Gender Diversity |
| Above 90 Acts |
Larger Festivals |
Decreased Diversity |
| Curatorial Team Composition vs. Gender & Non-Binary Inclusion |
| Curatorial Team Type |
Women Representation |
Non-Binary Representation |
| All-Male Team |
20.4% |
0.5% |
| Mixed-Gender Team |
27.7% |
— |
| All-Female Team |
44.4% |
4.2% |
BASCA Study on Diversity in New Music Composition (UK, 2019)
| BASCA Study on Diversity in New Music Composition (UK, 2019) |
|---|
| Gender Representation in Music Composition Education |
| Female Composition Students | 36% |
| Undergraduate Female Composition Students | 39% |
| PhD-Level Female Composition Students | 14% |
| Commissioning & Awards Statistics |
| Commissions Submitted by Women | 21% |
| Orchestral Commissions Awarded to Women | 7% |
| Sonic Art Commissions Awarded to Women | 39% |
| Curators Lacking Diversity & Equality Policies | 70% |
| Age Breakdown of Female Composers |
| Composers in their 20s | Same representation as older age groups |
| Composers in their 40s, 50s, 60s | No significant difference |
| Methods for Securing Commissions |
| Artistic Director-led Decisions | 72% |
| Personal Contacts | 14% |
| Competitive/Tender Process | 5% |
Women in the US Music Industry – 2018 Study Findings
| Women in the US Music Industry – 2018 Study Findings |
|---|
| Gender Discrimination & Harassment |
| Cited gender discrimination, harassment, or abuse as career barrier | ~33% of respondents |
| Reported different treatment due to gender | 78% |
| Felt gender affected employment | 52% |
| Stronger impact among self-employed/freelancers | Yes |
| Career Advancement & Representation |
| Women who felt behind in careers (white respondents) | 44% |
| Women of colour who felt behind | 55% |
| Top-level company positions male vs. female | 75% male, 25% female |
| Mid/lower-level positions | 100% female (per one respondent) |
| Workplace Environment & Support |
| White women who felt supported vs. women of colour | ~10% higher support among white women |
| Women aged 18–24 | Least comfortable, yet most supported |
| Self-employed/freelancers (esp. performers) | Least comfortable |
| Education/training roles | Most comfortable |
| Common challenges cited | Not being taken seriously, ‘boys’ club environment |
| Additional challenges for specific groups | Women of colour, older women, disabled women |
| Career Satisfaction & Development |
| Women satisfied with their primary job | 72% |
| Mentorship and networking linked to earning >$40K/year | Yes |
| Mentored women felt more career satisfaction | Yes |
Race- and gender-based under-representation of creative contributors: art, fashion, film, and music
| Domain |
Sample Size |
% Women |
% Minority Racial/Ethnic Groups |
Other Notes |
| Contemporary Art |
2,229 |
28% |
22% |
White men overrepresented ×1.4–2 |
| Fashion |
889 |
45% |
22% |
White men overrepresented ×1.4–2 |
| Film (Box Office) |
1,580 |
27% |
19% |
White men overrepresented ×1.4–2 |
| Popular Music |
221 |
17% |
48% Black artists |
High visibility ≠ inclusion |
| U.S. Population Benchmark |
— |
51% |
39% |
Intersecting identities largely underrepresented |
Male communication styles have historically influenced the leadership, as well as the creative, commercial, and political cultures of Western societies. As a result, the perspectives and voices of women and minorities often encounter bias and are less frequently emphasized. Orchestral scheduling practices are heavily influenced by traditional habits that favor established voices and methods. Therefore, new voices struggle to break through the glass ceiling because curators tend to favor familiar and trusted choices. Leadership that is inclusive and non-exclusive curation practices challenge these exclusionary approaches (Juhl, 2021).
Exclusionary curatorial gatekeeping stifles innovation, new styles, and diverse cultural expressions. Inclusive curation isn’t just about statistics; it aims to fundamentally change cultural norms within platforms and democratize influence and opportunity. The art and music worlds continue to marginalize unconventional expressions, hindering the growth of diverse voices unless these frameworks are critically challenged. Over a thousand women surveyed suggested that industry-wide efforts be made to foster meaningful and ongoing change. Other proposed solutions include increasing diversity and expanding representation by employing skilled women and providing equal opportunities to address bias, exploitation, and systemic issues (Juhl, 2021).
The annual symphony orchestra program is usually curated by an artistic or music director, making it a very unique process. An orchestral program is designed to be understandable throughout an entire season as well as during specific concerts. The programming of most large ensembles tends to be traditional. Composer and conductor Diane Wittry stated that listeners’ preferences must be considered; however, efforts should be made to push boundaries by including rarely performed compositions. New musical pieces are, however, rarely performed again after their debut. The most important constant in programming is the style of arrangement, such as concerto or overture, which generally follows a specific structure. Additionally, the few composers included in the sets are combined using specific techniques, leaving little room for new composers and works. Furthermore, if set programs must follow particular arrangements, there is limited opportunity for experimentation (Juhl, 2021).
Another reason for the lack of diversity in contemporary composition is the societal factors affecting the reception and perception of women composers, as well as the importance of role models. According to their paper, Western art music is characterized by being created by a socially, racially, and gender-homogeneous group of men, and the dominant tradition in composition is therefore rooted in male composers. As a result, the understanding, analysis, evaluation, and criticism of composed music are judged through a mainstream culture where some things are valued as meaningful and prestigious over others. This has excluded women from the canon of music theory and prevented them from reaching significant status or tradition in performance, leading to their underrepresentation in repertoires (Juhl, 2021).
This dominant culture influences all facets of the music industry, from academia to critics and promoters. Patterns arise from ideology and acculturation in Western society, forming the foundation for those with critical authority. Internalized musical values from male predecessors and contemporaries create a pre-evaluative context for shaping critical discourse. The act of criticism—authoritatively assigning value to music—has often been governed by the male experiential model. The exclusion of women’s perspectives and works has limited the standards and reinforced existing modes of musical expression. Consequently, music by women composers was created by and perhaps for people different from those who sanctioned the canon, meaning that alternative or additional discourses are neither welcomed nor seen as valuable, but reserved for music composed by or for the dominant culture (Juhl, 2021).
As a result, women and minorities have been excluded from the norm. This devaluation contributes to professional barriers for women. This form of bias is rarely spoken openly, but its impact persists, creating obstacles women face that men may not encounter or even notice. Women working in male-dominated fields report stereotype-based challenges that influence perceptions of their suitability for their roles, leading to fewer opportunities. Moreover, lower-status employees, such as women and minorities, are held to higher standards and must prove their abilities more to advance equally (Juhl, 2021).
Diversity is not simply a label for specific individuals or musical sounds and repertoires. It is understood as a socially organized difference that is produced and expressed through complex relations and interactions between people and social groups. The politics of diversity involves the daily processes by which individuals exercise agency, negotiate power and identity, and assign meaning to differences. Multicultural education aims to empower all students to become informed, compassionate, and active citizens in a world that is deeply troubled and ethnically divided (Kallio et al., 2021).
Music education offers a space where all learners can be engaged as a community. It brings them together through musical practice and enhances their intercultural awareness. An intercultural approach has the potential to reduce the influence of cultural stereotypes by fostering an understanding of the universality of musical practice and the unique sonic qualities of different musical traditions through the creation of new values and the transcendence of both individual and social cultures. It is nonsensical to claim that we can understand music without understanding the culture from which it originates. The music is the culture (Kallio et al., 2021).
Teachers were instructed to view music as a universal phenomenon that can exist independently of sociocultural context or social bonds and transcend the power dynamics associated with diversity politics in any educational setting. Scholars at the intersection of music education and ethnomusicology challenged this view, arguing that artistic expression becomes diluted when it is homogenized because art is inherently specific. As a result, scholars regarded music as a “pan-human” experience and a “culture-specific” tradition that requires careful consideration when transmitted from its original context to educational settings. Some scholars suggested that educators should uphold authentic musical expressions, while others emphasized the importance of re-imagining them. Music serves as a powerful tool for cultural identification, fostering intercultural appreciation, and breaking down barriers among various ethnic, tribal, traditional, and linguistic groups. It also has the potential to influence the creative process, reduce discrimination, promote equitable teaching methods, and help build an empowering school culture (Kallio et al., 2021).
References
Juhl, I. N. (2021). Creating inclusion and diversity in music – The role of curation and gatekeeping (Bachelor’s thesis). Iceland University of the Arts. https://skemman.is/handle/1946/38943
Kallio, A. A., Marsh, K., Westerlund, H., Karlsen, S., & Sæther, E. (2021). The politics of diversity in music education. Springer Nature. https://doi.org/10.1007/978-3-030-65617-1_1
Smith, S. L., Lee, C., Choueiti, M., Pieper, K., Moore, Z., Dinh, D., & Tofan, A. (2021). Inclusion in the Music Business: Gender & Race/Ethnicity Across Executives, Artists & Talent Teams. USC Annenberg School for Communication and Journalism. https://assets.uscannenberg.org/docs/aii-inclusion-music-industry-2021-06-14.pdf
Topaz, C. M., Higdon, J., Epps-Darling, A., Siau, E., Kerkhoff, H., Mendiratta, S., & Young, E. (2022). Race- and gender-based under-representation of creative contributors: Art, fashion, film, and music. Humanities and Social Sciences Communications, 9, Article 221. https://www.nature.com/articles/s41599-022-01239-9